(A detailed explanation of arguments presented in the paper: Doss, 2013)
By Mohan Doss
Version 2.2, Aug 12, 2013
1. LINEARITY OF DOSE-RESPONSE
The abstract of the paper Ozasa et al. 2012 (LSS 14 Report, 2012) says in
part:

The above statement appears to imply that the atomic bomb survivor
data continues to support the linear model for dose response for
radiation-induced cancers. However, please note the following data
described and presented in the paper: On Page 234 it says:

On Page 237, in Table 7 (see below), P=0.02 for
curvature is significant in new data

On Page 238, it says:

The above quotations from the paper represent a major new finding (significant curvature in dose response curve
arising from lower than expected cancer rates in 0.3 to 0.7 Gy, a finding
without a current explanation) in this update of atomic bomb survivor data in
comparison to earlier updates. However, this is not mentioned in the
abstract – thus, anyone reading the abstract to get an essence of the
publication would not be aware of this significant deviation from linearity in
the data. (The finding is without explanation because the authors of LSS 14
Report relied exclusively on the LNT model hypothesis and did not consider the
alternative hypothesis of radiation hormesis.) On the other hand, the paper
says on Page 238-239:

It is true that adding more and more data points
at high doses above 2 Gy can reduce the significance of the dose reduction at
0.3 to 0.7 Gy in a statistical sense. However, the underlying assumptions
of the LNT model (the higher the dose, the higher the DNA damage and mutations,
and the higher the cancer incidence) are not supported by the significant
observed reduction in cancers in this dose region. This reduction cannot
be explained using the LNT model. Thus,
the dose response observed in the new update to atomic bomb survivor data is
certainly not linear, in spite of their above statement that over the whole
dose range, linear model provided the best fit. The reduction of the
cancers at ~0.5 Gy was hinted in the survivor data presented in the BEIR VII report (see
figure below), though it was not statistically significant. (Please note
Standard Errors used for Error bars in these two graphs below).


In the LSS 14 update, there is no data point at
0.5 Gy (see figure above), but data have been presented at 0.4 and 0.6 Gy.
Since the region of 0.3-0.7 Gy has been identified as having lower than
expected cancer rates by LSS 14 Report, it appears likely that a data point at
0.5 Gy (center of this dose range) would have been lower than the data points
at 0.4 Gy and 0.6 Gy. Thus, the dose values the authors of LSS 14 Report
have chosen to use for display in this plot tend to underplay the reduction of
cancers in this dose region in this graphical representation of the data.
Whereas the qualitative shape of the dose
response curve (Up-Down-Up, with Down near 0.5 Gy) cannot be explained with the
LNT model, there is a possible explanation for this shape using radiation
hormesis model, as detailed in (Doss, 2012; Doss, 2013).
The unwavering reliance on the LNT model prevented the authors of LSS 14
Report from finding a plausible explanation for the newly observed significant
reduction of cancers near 0.5 Gy. Once the possibility of
radiation hormesis is considered, no sophisticated analysis is required to note
that the Up-Down-Up shape of dose response is compatible with the Down-Up shape
of dose response of radiation hormesis.
It took only elementary algebra (see Appendix A of Doss, 2012, reproduced below) to derive a correction for the bias in
baseline cancer rates, that converted Up-Down-Up shape to Down-Up shape as seen in Figure 3 of the publication (Doss,2012) - reproduced below. When such a correction is applied to the LSS 14 data, a J-shaped dose response curve is obtained as seen in Doss, 2013 and plotted in Figure 3 below. In this figure, data below 0.3 Gy have been averaged to smooth the large fluctuations in the LSS 14 data below 0.3 Gy:
Figure 3: Excess relative risk
(ERR) for all solid cancer in atomic bomb survivors corrected for bias in
baseline cancer mortality rate, plotted as a function of colon dose, for -20% bias in baseline cancer mortality rate. ERR values of the data points for colon dose < 0.3 Gy have been averaged and plotted at the mean dose of
the data points, in order to smooth the large fluctuations in the ERR values
below 0.3 Gy seen in LSS 14 data. The obvious requirement that ERR=0 at zero dose has been added as an additional
data point. Error bars: 95% CI.

Because of dosimetric uncertainties for the
LSS cohort, the value of dose at which the negative ERRs (cancer prevention) occur would need to be
determined in future studies, and could be much different from what is seen in this graph. Thus, the qualitative conclusion that can be drawn from this analysis is that the Up-Down-Up shape of dose-response curve observed in LSS 14 data becomes Down-Up shape (indicating radiation hormesis) when a correction is applied for a bias in baseline cancer mortality rate.
Appendix A from (Doss, 2012)

Figure 3 of publication (Doss, 2012)

2.
NO-THRESHOLD DOSE FOR CANCER RISK
The abstract of the LSS 14 Report
says:
On Page 231 it says:

The functional form they used for threshold
analysis: r(d)=β1(d–d0)
for d>d0 or r(d)=0 for d£ d0,
where d0 is the threshold, did not allow the ERR values r(d) to
extend into negative values whereas one of the data points and 95% CI of 8 of
the 10 data points below 0.25 Gy (in Figure 4) do extend into negative values
(see data from Part of Figure 4 reproduced below). Thus the functional form that was chosen was
severely restricted, and could not go through one of the data points, and also
through the 95% CI region of 8 of 10 data points for the lowest doses. The functional form chosen was therefore not
appropriate – not general enough – so any conclusion from the dose threshold
analysis would not be valid.
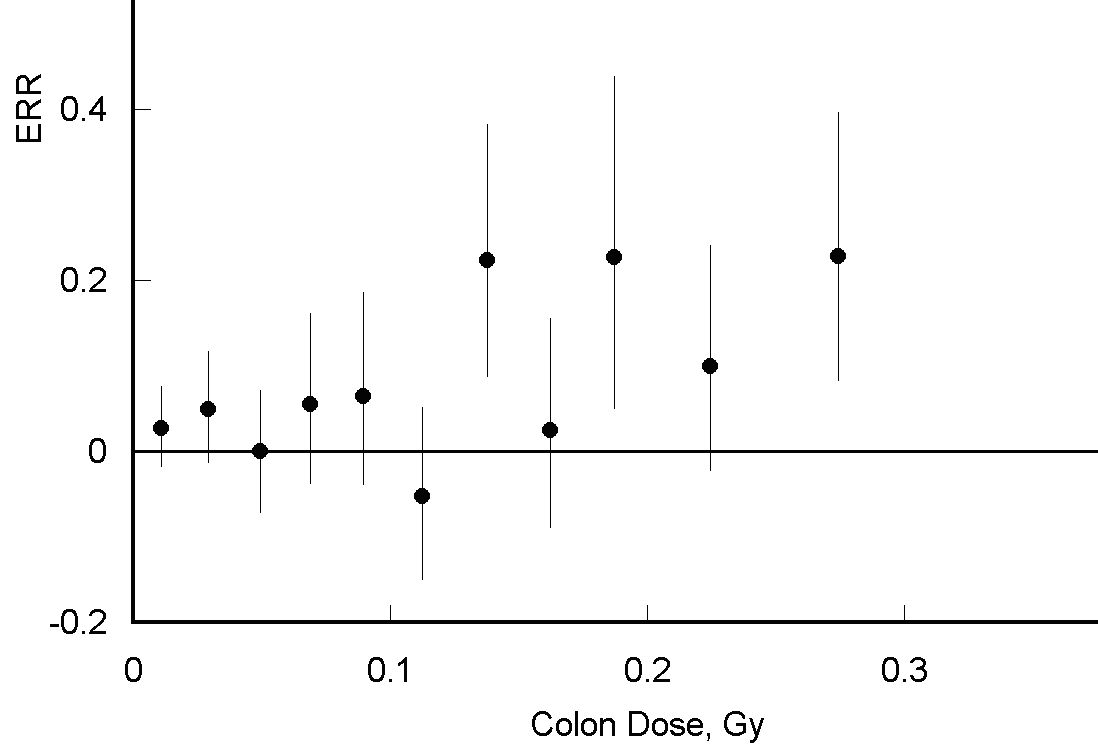
Figure 3. Magnified plot of data from Part of Fig. 4
from (LSS 14 ERRATA, 2013).
Error bars show
95% Confidence Intervals.
If they had used a more generalized functional
form, they would likely not have concluded that zero dose is the best estimate
of the dose threshold, as the lower bounds of the point-wise 95% CIs would
likely have been below zero for some low doses, as for example determined in
the analysis shown in part of Figure 2 of (Doss, 2013) shown
below.

Figure
4. Magnified part of Figure 2 from (Doss 2013)
Not using a more general functional form, and
assuming in the functional form what one is trying to conclude (no threshold
dose) is a fundamental error of analysis.
Thus, the atomic bomb survivor data do not support the conclusion of the
absence of a threshold dose, contrary to the claims of the paper.
One criticism of the analysis in (Doss, 2012; Doss, 2013) is that raw data from survivors were not used, but the ERR
estimates at specific doses which are fitted values were used. Our response to the criticism is that since
the low dose region was represented by a large number data points at fine
intervals, it is likely that the conclusions of the analysis in (Doss, 2012; Doss, 2013) are likely to be validated when the analysis is performed
using the raw data. This remains to be
confirmed.
When the Comments paper
(Doss et al, 2012) was accepted for publication, the authors of LSS 14 Report
were given as opportunity to respond to the comments in the paper. The authors of LSS 14 Report have chosen not
to respond to the Comments paper by publishing a rebuttal so far, possibly
indicating they do not have an effective rebuttal to the ideas presented. If there is an effective rebuttal, we would be
interested in hearing it, and taking it into account.
Conclusion:
With the improved statistics in the latest
updated LSS 14 Report, the shape of dose response has become clearly non-linear
with the significant negative curvature in the low dose range of 0.2-0.6
Gy. The atomic bomb survivor data no
longer provide evidence for the LNT model, neither for the "Linear"
part, nor for the "No-Threshold" part. Since the BEIR VII report has claimed the atomic bomb survivor data as the single most important
resource for determining low dose radiation effects as mentioned on page 141 of
the Report,

and used the atomic bomb survivor data to rule
out radiation hormesis and presence of threshold (see page 10 of the Report),


when BEIR committee considers the new data, their
conclusion regarding the support for the LNT model would need to be reversed,
since the LSS cohort data no longer provide evidence for the LNT model but are
consistent with the radiation hormesis model (Doss 2013).
References:
(Doss, 2012) Evidence Supporting Radiation
Hormesis in Atomic Bomb Survivor Cancer Mortality Data. Dose Response. 10:
584-592. Available at :
(Doss et al., 2012) Comments on "Studies of
the mortality of atomic bomb survivors, Report 14, 1950-2003: an overview of
cancer and noncancer diseases" (Radiat Res 2012; 177:229-43). M. Doss, B.
L. Egleston and S. Litwin, Radiat Res 178, 244-245 (2012).
Available at: http://www.ncbi.nlm.nih.gov/pubmed/22817395
(Doss, 2013) Linear No-Threshold Model vs.
Radiation Hormesis. Dose Response: In Press. Available at:
(LSS 14 Report, 2012.) Studies of the mortality
of atomic bomb survivors, report 14, 1950-2003: an overview of cancer and
noncancer diseases. Radiat Res 177: 229-43. Ozasa et al.
(LSS 14 ERRATA, 2013.) ERRATA for Volume 177,
number 3 (2012) in the article "Studies of the mortality of atomic bomb
survivors, report 14, 1950-2003: an overview of cancer and noncancer
diseases". Radiat Res 179: e0040-e0041.
Ozasa et al.
© 2013 by
Mohan Doss
8/10/2013